“Use the right tool for the job!”
Well, sometimes, I need a hammer that can drive nails, remove them, drive screws, and open a bottle of beer (without opening up my flesh at the same time). In the case, I’m building a Power BI report but need to incorporate a data table.
Sounds basic, except that included in the data are text-based values, not numbers. And I’m not using aggregation or calculation, so the default methods of conditional formatting in a Power BI table don’t work for me. The right tool here would be Excel where I can apply conditional formatting pretty much however the heck I want.
I don’t want to use Excel.
Here’s what I want to see:

And here’s how I did it.
In the PowerQuery editor, I added conditional columns that defined the HTML hex code color I want to use, depending on the text value:

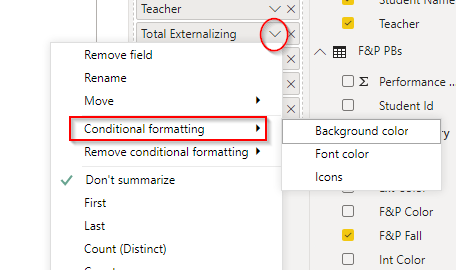
Then, back in my report, I choose the field that’s included as a value in my table, open the dropdown menu, choose Conditional Formatting and Background color:

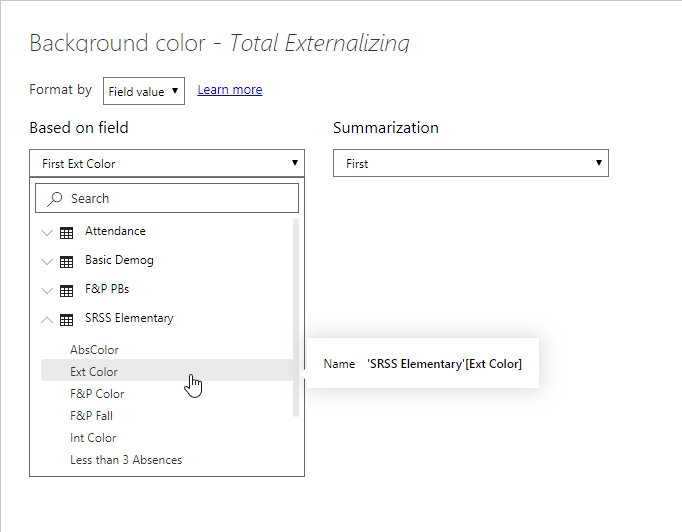
I’m formatting based on the field value, and choosing the column that contains the color value (in this case, “Ext Color”). I don’t care about the choice in “Summarization.”

And that applies the color choice to the column based on the value within the cell.
