I love watching hockey. I’m a little sad that I’ve never actually played, but not by much. And being a self-professed nerd and geek, I’m naturally attracted to the statistics of hockey.
An aside: I am not to the point of being a statistician and analytics expert; I read the analytics articles on various hockey sites and I get lost.
For 20 years, I’ve been tracking various bits and pieces of hockey data in Excel. For the majority of the time, it was all manual entry with the performance line (W, L, OTL, etc.). Naturally, I could calculate points, max points possible, goals per game, points per game and so on.
But I needed more automation because manual entry is a thing of the past. After falling into Excel’s Get & Transform (twin to Power BI’s Power Query), automation began to take hold.
This is the base worksheet of my Excel workbook. Looks familiar to anyone who’s looked at league standings, regardless of sport.
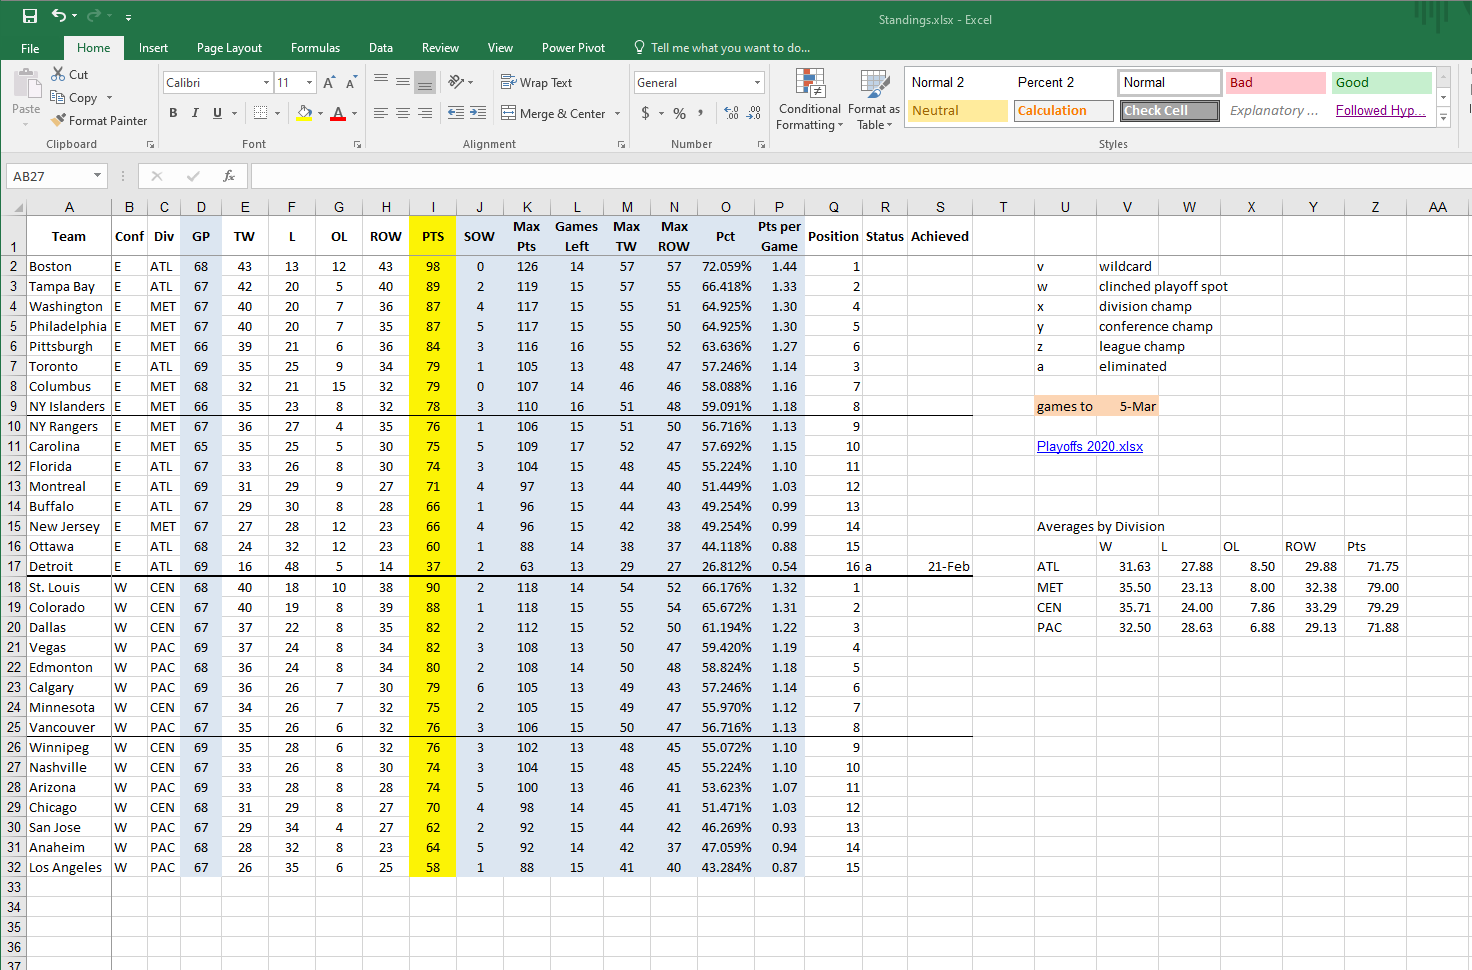
Most of the cells are formulas. The highlighted columns would be the obvious choices for calculations, and those were ones I had for a long time already. Teams rarely change, and when they do, it’s monumental enough to where manual updates are going to be necessary.
Atlanta folding and moving to Winnipeg, changing names, conference, and division. The birth of Vegas. The division realignments of 2014.
So columns A, B, and C are okay being manual (though I automated that as well; more below). But I was sick of manually updating the wins, losses, and OTLs. There HAD to be a better way. And yes, there is.
Enter Get & Transform. Details are in this link, so I won’t waste space explaining it here.
I created a reference worksheet to house the link to an online source that updates current year standings. Then, using G&T, I manipulated the source to output what I wanted.
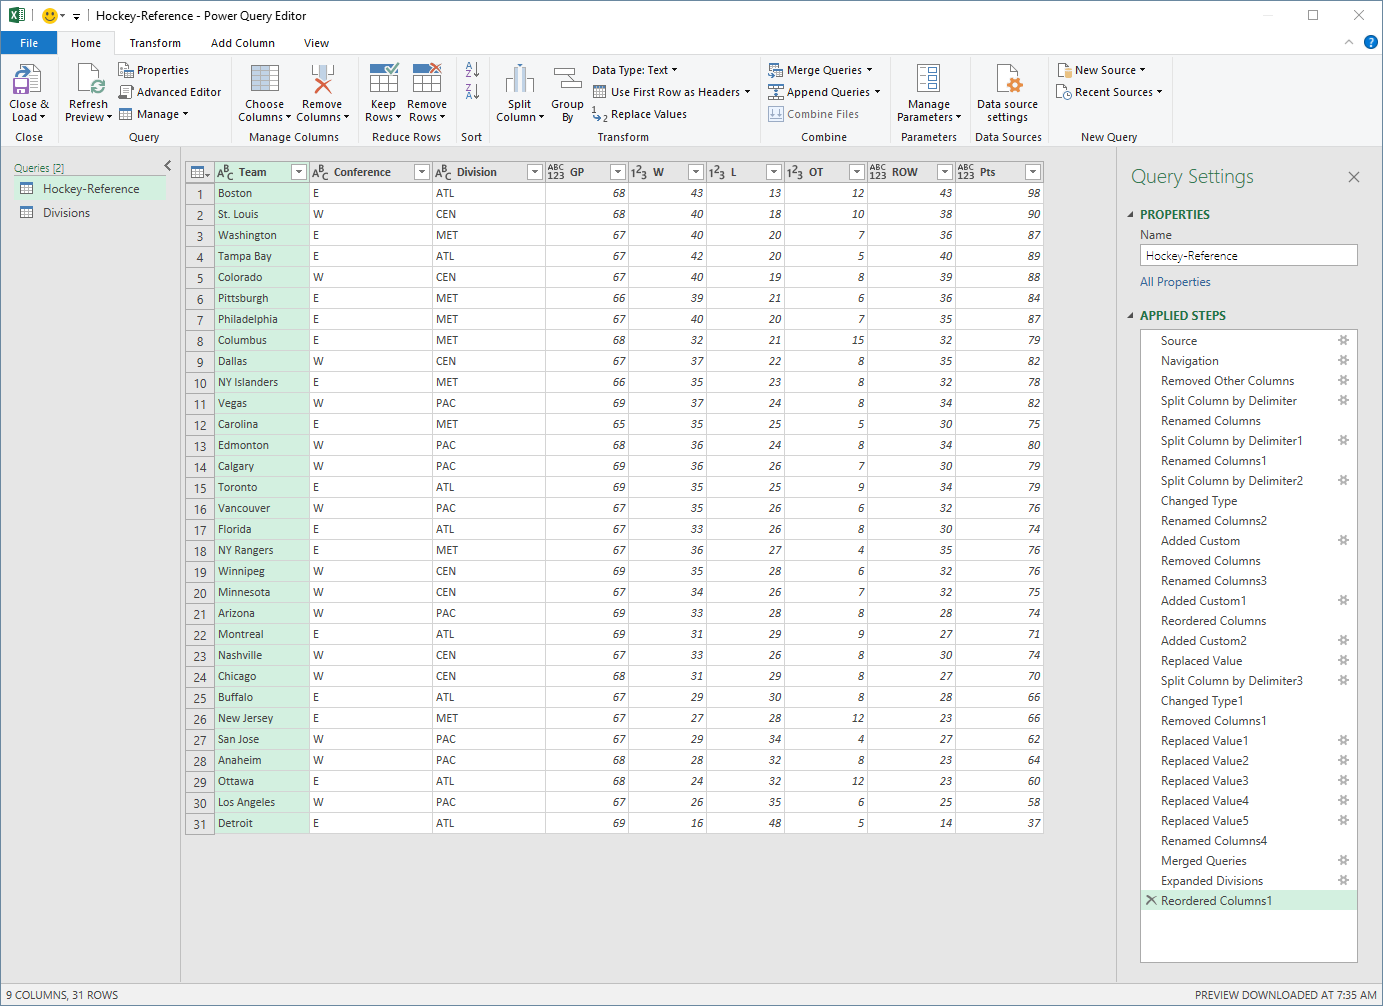
The “Divisions” query in the left column is what I was mentioning. At the end of the workbook list, I have the teams, conference, and divisions laid out because the source I was using had those listed in a way that I couldn’t use. Using a merge, I pulled together the team names, conference, and division.
All the steps on the right are how I manipulated the original Web source to look how I wanted it. This resulted in the “live feed” worksheet.
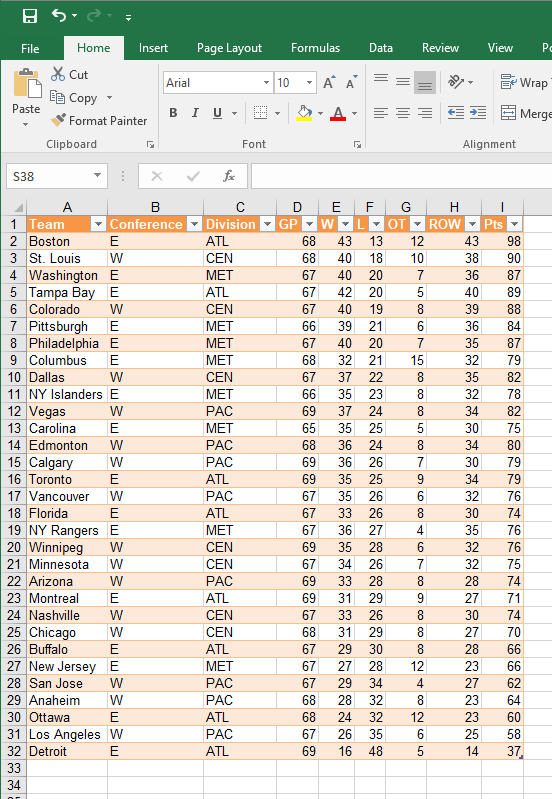
Now that we’re out of Narnia (what I call the Get & Transform environment; if you’re curious why Narnia, come to a session I’m teaching on this topic), I can use it on the detailed worksheet.
In each of the result columns, I’m using a VLOOKUP:

I should be using an INDEX/MATCH to get away from so much dependence on VLOOKUP. I’ll probably get there next season.
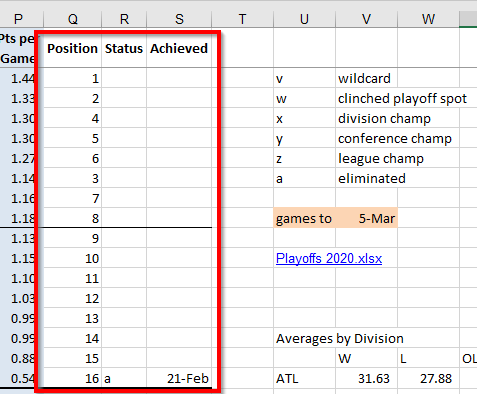
What I haven’t figured out yet, though, is how to label playoff position. Since the NHL rules are a little more complex than just “top 8 teams in each conference get in,” I haven’t figured out how to capture those sorting rules in a formulaic manner. Maybe next season for that, too!
I was reading the recap of the Red Wings – Blackhawks game of last night (3/6/20). Wings won 2-1, and this line in the article struck me as notable.
Chicago is last in the Central Division despite having a winning record and its point total doubled Detroit’s entering the game.
That piqued my curiosity. I looked in my standings sheet, and sure enough, the Blackhawks are 31-29-8 but rank last in the division and out of the playoff picture.
That indicates that the Central is the strongest division in the league. Visually, I’m guessing that Atlantic is the weakest division, then (based on the performance of Detroit and Ottawa). But how do I verify that?
Let’s look at averages for the divisions.
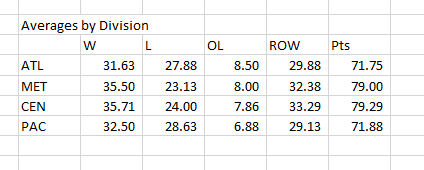
The formula here uses AVERAGEIF. AVERAGEIF will grab the cells that you need based on certain criteria. In this case, I wanted to calculate the average of all cells in the source if the reference matched. The reference I’m using is the division abbreviation in the first column, which matches the division values in Column C of my standings table.
For each of the W-L-OL-ROW cells, if the division matches, average those values. For the wins cell, the formula is =AVERAGEIF($C$2:$H$32,$U17,$E$2:$E$32)
$C$2:$H$32 is the absolute reference covering the columns from division through ROW, and of course, 2 through 32 refer to the individual team rows.
$U17 is the absolute column within this averages table that contains the reference division. 17 is a relative notation because when I copy/paste this formula to the other cells, I want the rows to change accordingly but not the column so I can continue to reference the division.
E$2:E$32 is the range of the values I want averaged, based on the reference division. The column is relative while the rows are absolute. Since the W-L-OL-ROW is in the same order in the standings as well as in my averages table, I can accept Excel adjusting the columns in the formula automatically.
Now I can confirm that, based on average points earned by teams per division, Central is the strongest division with 79.29 points and Atlantic is weakest with 71.75 points.
There are some cube functions also in Excel where I could probably pull the teams by division, combine the new table with the average then plot them visually, but I’ll probably do that next season as well.
Why Does Any of This Matter?
Seems like a total waste of time since I’m not up to the caliber of hockey analytics people like TSN’s Travis Yost or the analysts being hired by NHL teams directly now. But it does feed my curiosity by putting the data that I want to see in one spot without having to click everywhere on the Internet.
It also serves as practice, learning new functions and how they behave. Then I can put that to better use on the job. So what starts as hockey stats can become analytical methods for student data.
